Gisela Hoffmann · 18 October 2026
Dewwald Researchers Track How Microclimates Influence Vineyard Yields Across the Region
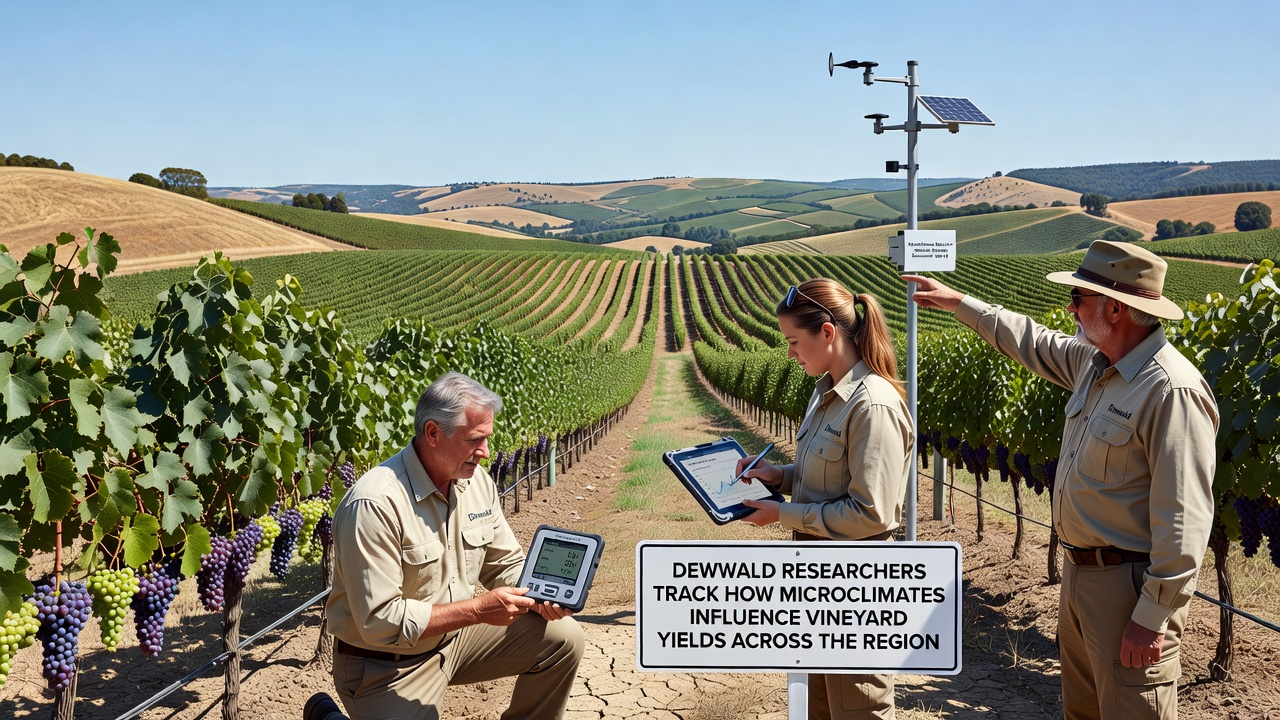
Researchers across the Dewwald region have spent the past three years mapping temperature gradients, humidity pockets, and wind patterns that shift dramatically within single vineyard blocks, and their data shows these variations directly shape grape development and final harvest volumes. The project, coordinated through local agricultural institutes, began collecting continuous readings in 2023 and expanded sensor networks during the 2025 growing season. By October 2026 the team had compiled enough seasonal cycles to release preliminary yield correlation models that vineyard managers now use when planning canopy management and irrigation timing.
Regional Landscape and Vineyard Distribution
Dewwald sits on a patchwork of slopes and valley floors where elevation changes of only thirty meters can alter daytime heat accumulation by several degrees, while morning fog often lingers longer in lower pockets and delays photosynthesis. Vineyards planted along the eastern ridges receive earlier sun exposure yet experience stronger afternoon breezes that reduce disease pressure, whereas plots tucked behind forested hills retain moisture and show slower sugar accumulation. Soil composition further compounds these effects, with limestone outcrops warming faster than clay-loam depressions and influencing root-zone temperatures that researchers record at multiple depths.
Local records indicate that average yields have fluctuated between 38 and 62 hectoliters per hectare over the last decade, yet neighboring parcels often diverge by fifteen percent even when the same variety and rootstock are used. Observers note that traditional weather stations placed at the valley edge miss these fine-scale differences, which explains why earlier regional forecasts sometimes underestimated or overestimated production by noticeable margins.
Sensor Networks and Data Collection Methods
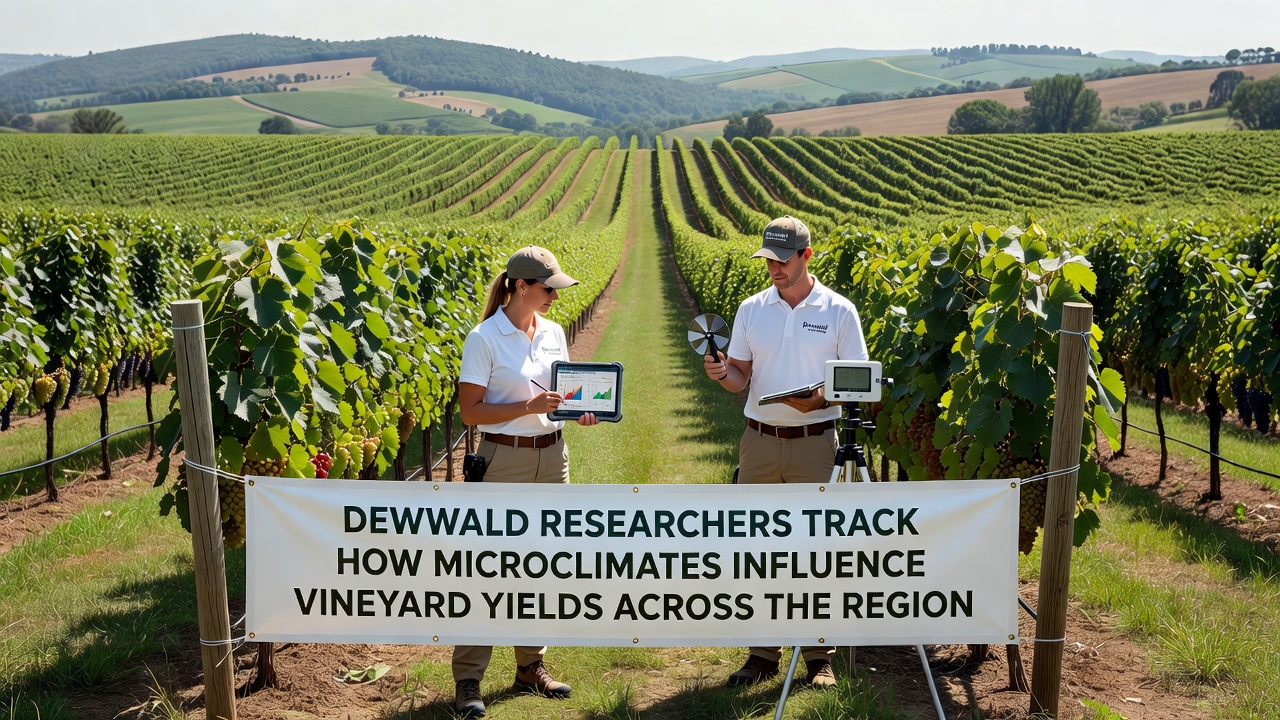
The current monitoring system combines wireless temperature and humidity nodes spaced every twenty meters, paired with soil probes and anemometers that log readings every fifteen minutes. Teams download data weekly and cross-reference it against manual berry sampling conducted at key phenological stages. In addition, drone-mounted thermal cameras fly selected blocks twice per month to capture canopy temperature maps that researchers compare against ground sensors. This layered approach allows them to isolate microclimate signals from broader weather events such as regional heat waves or late frosts.
Calibration visits occur monthly, and technicians replace batteries and clean lenses to maintain accuracy. The network now covers forty-two commercial vineyards and twelve experimental plots, producing more than eight million data points per growing season. Analysts run the raw numbers through open-source climate modeling software to generate daily heat summation maps and vapor-pressure deficit layers that highlight stress zones before visible symptoms appear in the vines.
Findings Released in October 2026
Analysis of the October 2026 dataset revealed that parcels experiencing more than two hours of additional morning fog accumulated 12 percent fewer growing degree days than adjacent exposed slopes, resulting in delayed veraison and lower final yields in cool-climate varieties. Conversely, blocks with consistent afternoon wind showed reduced botrytis incidence and maintained higher yields despite similar overall temperatures. Soil temperature differentials of three degrees Celsius at thirty-centimeter depth correlated with measurable differences in berry size and acid retention, according to figures compiled by the regional viticulture institute.
Researchers also tracked how these microclimates interacted with management practices. Vineyards that adjusted leaf removal timing based on real-time humidity readings preserved more fruit in humid pockets while still promoting airflow in drier zones. The data further indicated that irrigation scheduling guided by localized vapor-pressure deficit reduced water use by up to eighteen percent without yield penalty in most blocks. These patterns emerged consistently across three vintages, strengthening confidence in the models.
Practical Applications for Growers
Many Dewwald producers now receive weekly microclimate summaries through a shared online platform that flags emerging risks such as frost pockets or heat accumulation spikes. Growers report using the alerts to deploy wind machines or misting systems only where needed rather than across entire estates. The same system supports harvest logistics by predicting which blocks will reach optimal ripeness first, allowing crews to prioritize areas likely to lose acidity quickly under localized heat.
Extension services have begun incorporating the findings into training sessions for new vineyard workers, while several cooperatives are exploring variable-rate fertilization maps derived from the sensor data. Although the full economic impact remains under evaluation, early adopters note improved consistency in fruit quality metrics submitted to wineries.
Broader Regional Context
Similar microclimate studies have been conducted in other European wine regions, and the Dewwald team maintains contact with counterparts through the European Vine and Wine Observatory network. Data sharing agreements allow comparison of sensor protocols and modeling approaches, which helps refine techniques used locally. In addition, researchers reference long-term climate projections published by the European Environment Agency to assess how shifting baselines might amplify or dampen existing microclimate effects in coming decades.
Parallel work in Australia, coordinated by the CSIRO viticulture program, examines comparable elevation-driven temperature gradients and provides a useful reference for interpreting Dewwald results under different varietal and soil conditions. These cross-regional exchanges continue as the October 2026 dataset undergoes peer review.
Conclusion
The Dewwald microclimate monitoring initiative has produced a detailed picture of how small-scale environmental variations translate into measurable differences in vineyard productivity. Continued operation of the sensor network through subsequent seasons will allow researchers to test the stability of current correlations and update models as new management tools become available. Growers and cooperatives now have access to localized information that supports more precise decisions, while the broader agricultural community gains a clearer understanding of the interplay between terrain, climate, and yield outcomes across the region.